Visualization
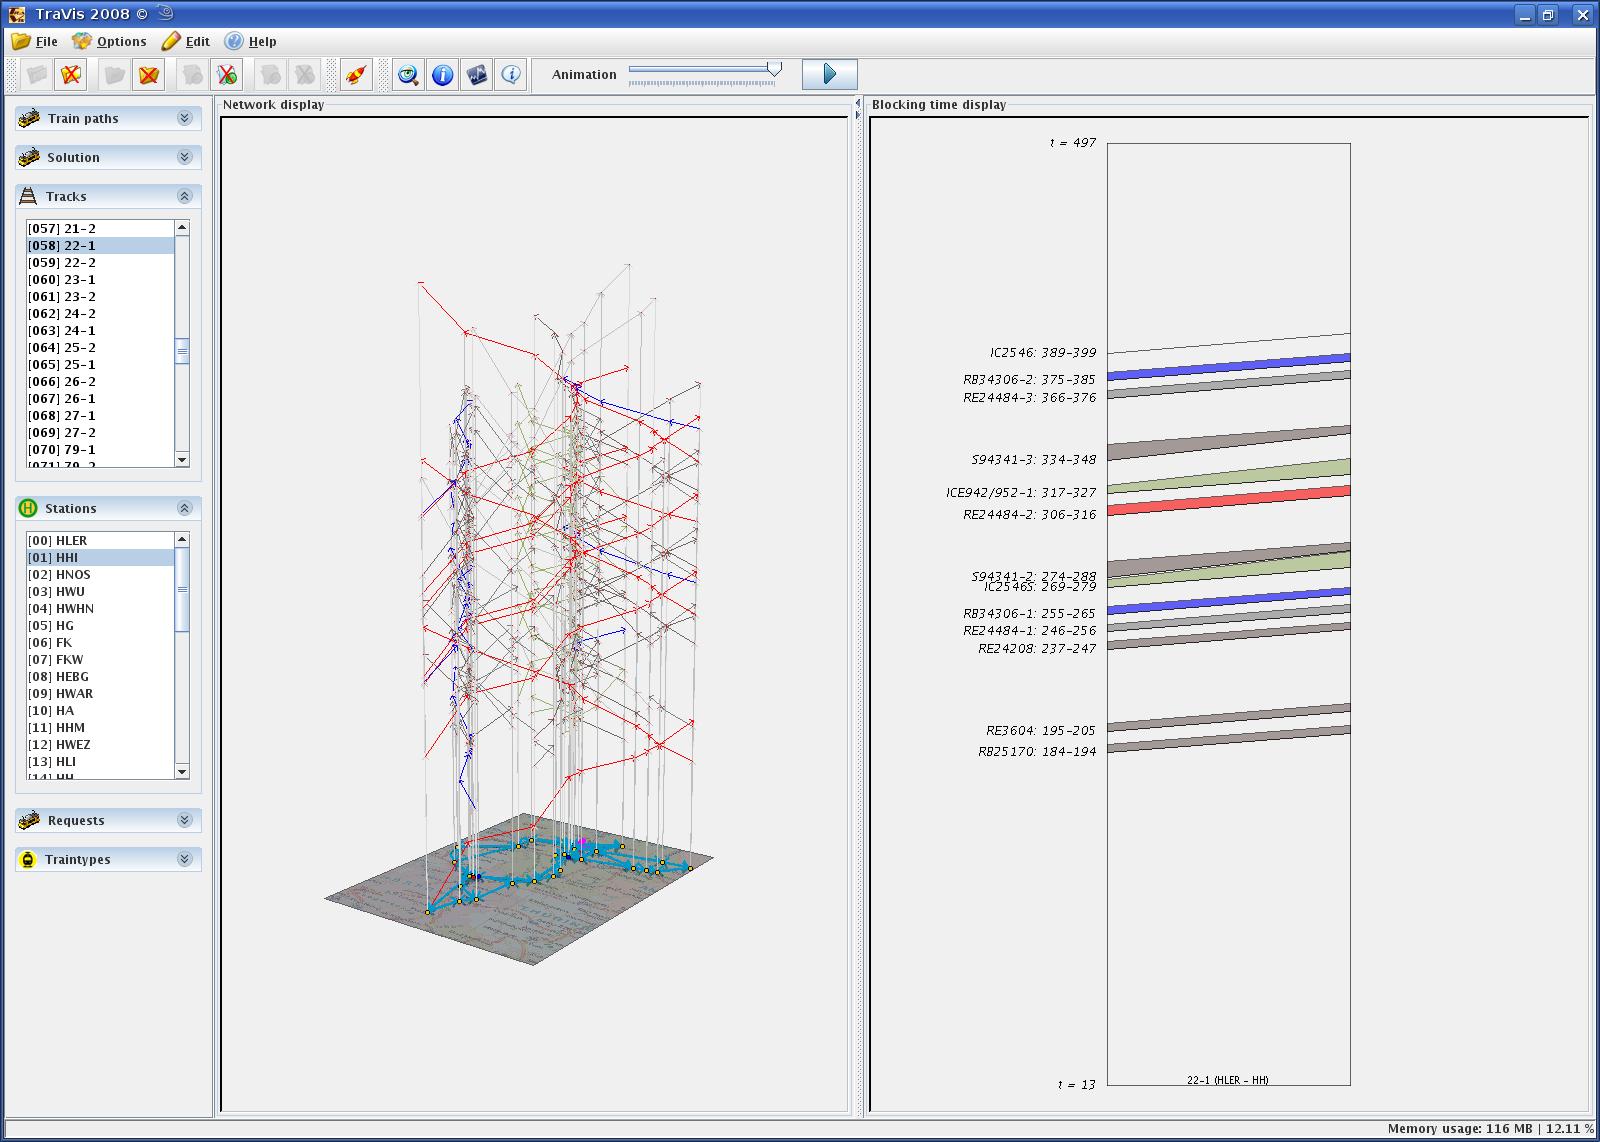
For a better understanding of what the Train Timetabling Problem is about visualizations of solutions or even algorithms are very usefull. For this purpose M. Kinder and B. Erol developed a tool called TraVis based on the 3D visualization software JavaView.
At present TraVis is only used to visualize macroscopic
infrastructure data and solution schedules
of the described file formats.
All provided functionalities are self-explanatory, such as "open network","open solution" and "start animation".
Nevertheless if you have any questions, ideas and suggestions on future development of TraVis please feel free and mail to travis zib.de.

Timetable or train schedule through the network in 3d on the left and single track headway display on the right.
See an example of the network display


